

An agent that burns $4,000 in a single malformed retry loop, hallucinates a customer’s financial data into a support ticket, or invokes a deprecated API seventeen times before timing out is not having a bad day. It is failing in ways your existing monitoring cannot see. Classic APM tells you the request completed in 340ms. It does not tell you the agent made three wrong decisions, violated two policies, and cost more than your entire API tier that hour.
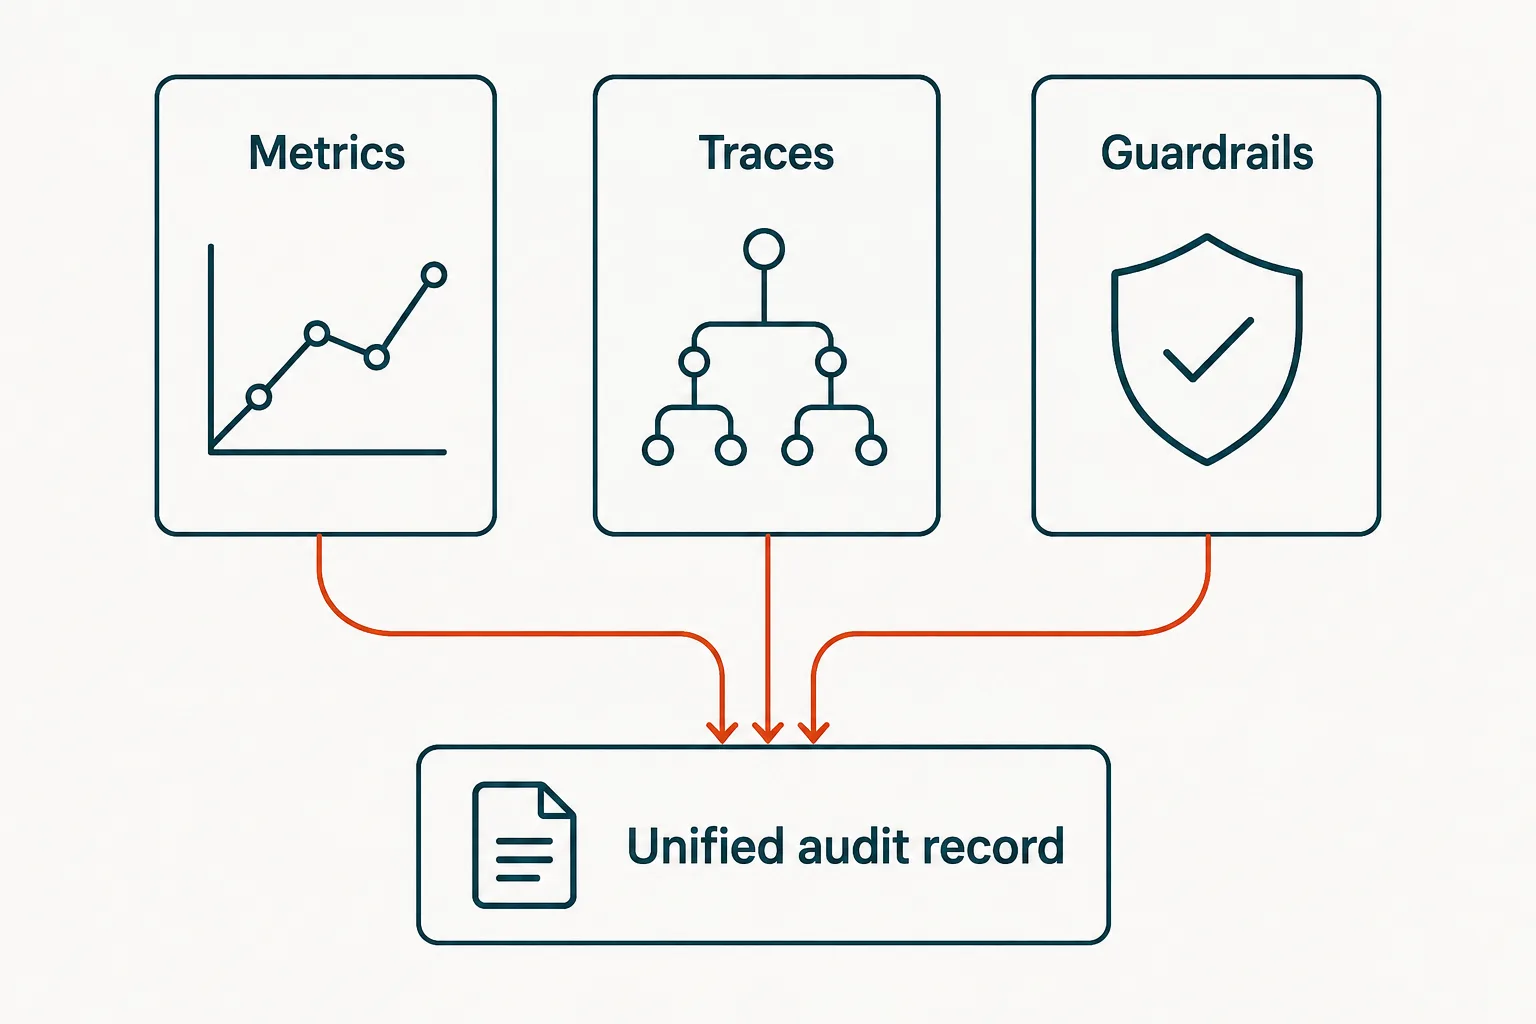
Production AI agents require observability built for decisions, not functions. Three layers write to one shared record. Metrics answer whether the agent is working. Traces explain why it made each decision. Runtime guardrails define what it is allowed to do. Together, these layers form the audit trail regulators and auditors demand, converting operational telemetry into governance evidence without a separate compliance pass.
Why isn’t classic APM enough for AI agents?
Application performance monitoring (APM) was built for deterministic code where the unit of work is a function call and the error budget is latency. AI agents break that model. The unit of work is a decision. A request succeeds when the agent answers the question correctly, not when the API returns 200. Failure modes multiply: a NeurIPS 2025 study of 1,600 traces across seven open-source multi-agent frameworks found failure rates between 41% and 86.7%, spanning 14 distinct modes including inter-agent misalignment, task verification breakdowns, and system design flaws. Classic APM records that a span completed. It does not record whether the agent hallucinated, exceeded its budget, or invoked the wrong tool three times before giving up.
The agent runtime is also orders of magnitude more expensive than the average microservice. Token overhead when tools attach ranges from 3.25x to 236.5x in benchmarked scenarios. A single malformed prompt can burn thousands of tokens before the first useful output. APM dashboards show throughput and error rate. They do not show cost per decision or tool-use efficiency, the metrics that determine whether an agent deployment survives its first invoice.
Which metrics actually matter in production?
Four groups define agent health. Outcome metrics measure task success: completion rate, answer correctness, user satisfaction scores. These answer the question every VP asks first: is it working? Cost metrics track spend per decision, token consumption, and tool invocation frequency. Performance metrics capture latency, queue depth, and retry count. Tool behavior metrics log tool selection accuracy, parameter validation failures, and the frequency of fallback paths.
Track these four:
- Outcome: task completion rate, answer correctness (human-labeled sample), user satisfaction score.
- Cost: spend per decision, total token count, tool invocation frequency.
- Performance: end-to-end latency (p50, p95, p99), queue depth, retry count.
- Tool behavior: tool selection accuracy, parameter validation failure rate, fallback invocation frequency.
OpenTelemetry GenAI semantic conventions define gen_ai.client.operation.duration as a required metric and specify standard dimensions for model, operation type, and error code. These conventions create a shared vocabulary. When every agent emits gen_ai.client.operation.duration tagged with gen_ai.operation.name = "invoke_agent", platform teams can aggregate cost and latency across vendors without writing custom parsers.
What should a trace record when the unit of work is a decision?
A trace must capture the reasoning path, not just the execution path. Start with the user prompt. Record each tool invocation as a distinct span with input parameters, output, and the decision logic that triggered the call. Capture the final response and the total token count. OpenTelemetry GenAI conventions define three span types: invoke_agent, chat, and execute_tool. Each span carries attributes for model name, token counts, and finish reason. Content capture is off by default to avoid logging sensitive data, but teams must enable it selectively to debug hallucinations and misaligned outputs.
The trace also records what did not happen. When an agent considers a tool and rejects it, log the candidate and the rejection reason. When a retry loop exhausts its budget, log the attempt count and the final error. The MCPGAUGE framework found that LLMs using Model Context Protocol exhibit token overhead between 3.25x and 236.5x depending on tool complexity. Without per-decision traces, that overhead is invisible until the invoice arrives.
Which guardrails belong in production and where do they sit?
Runtime guardrails enforce policy at decision time. They sit between the agent and the action it wants to take. Three categories matter. Input guardrails validate the prompt before it reaches the model, rejecting malformed requests and filtering prohibited content. Output guardrails inspect the agent’s response before delivery, blocking hallucinated citations and policy violations. Tool guardrails gate each tool invocation, enforcing parameter schemas, rate limits, and access control rules.
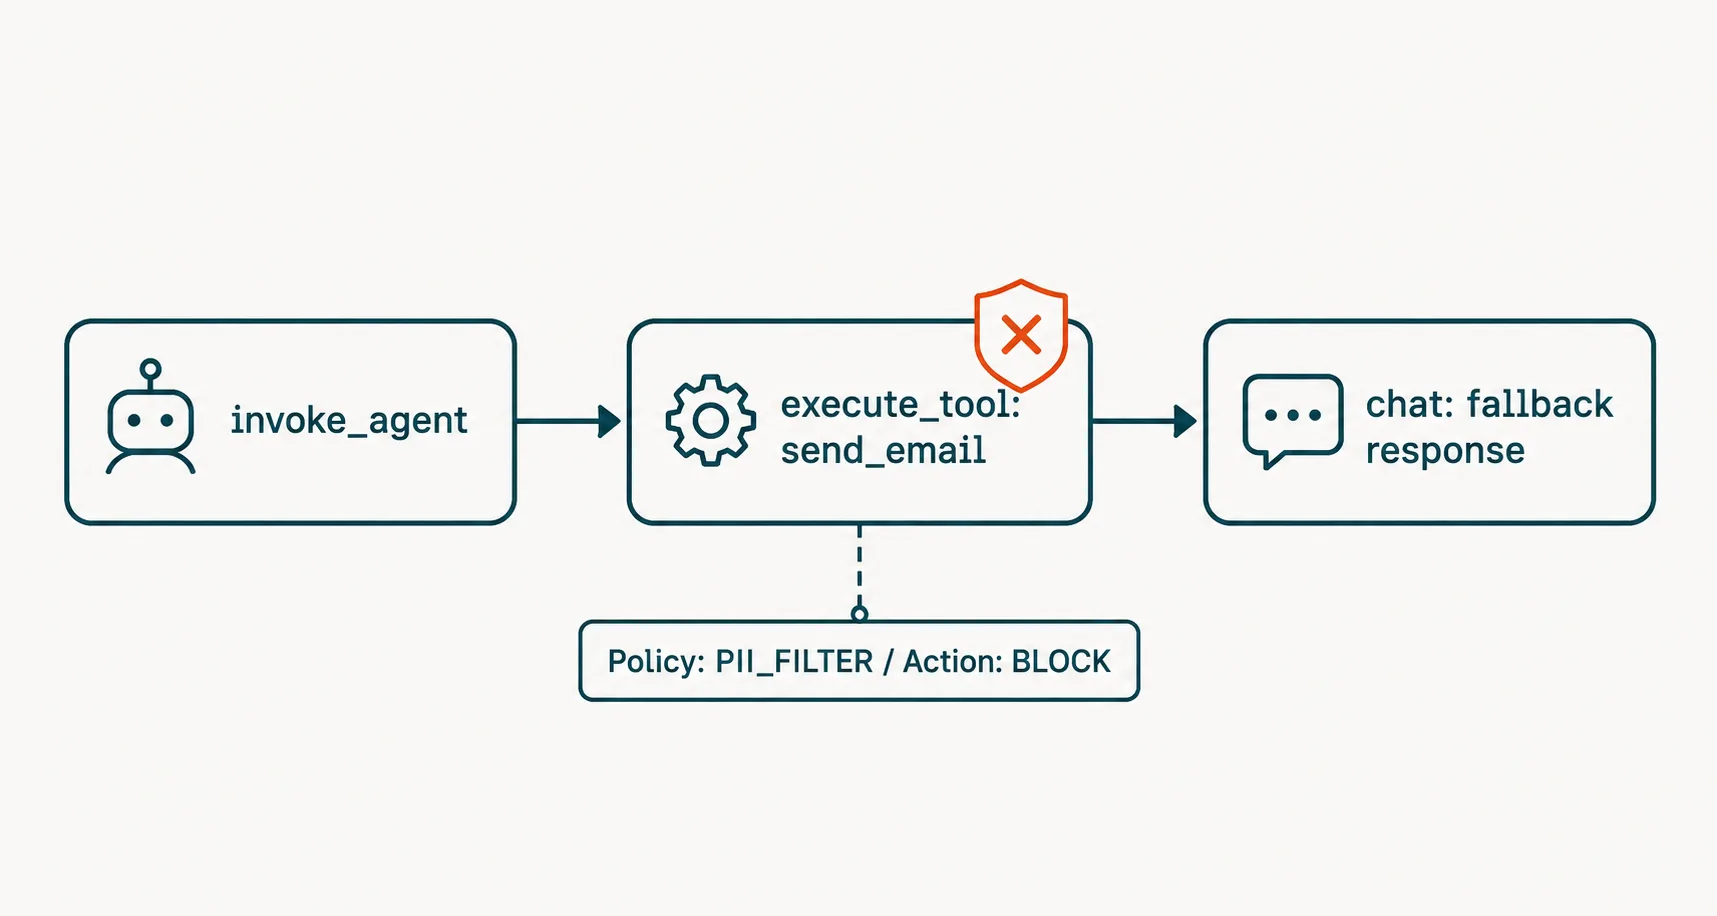
Guardrails must write their verdicts into the same trace as the decision they govern. When a guardrail blocks a tool call, that block becomes a span in the trace with attributes for the policy name, the blocked action, and the reason. This creates a complete record. An auditor reading the trace sees not just what the agent did, but what it tried to do and why it was stopped.
How does observability become governance evidence?
Structured telemetry is the audit trail. EU AI Act Article 12 requires automatic logging of high-risk AI systems with a minimum six-month retention period. The Annex III application deadline moved from August 2, 2026 to December 2, 2027 under the May 7, 2026 political agreement, but the logging obligation remains. A trace that records the prompt, the model invocation, the tool calls, the guardrail verdicts, and the final output satisfies that requirement without a separate compliance layer.
The difference between observability vendors and governance platforms is what they do with the telemetry. Arize, LangChain, Galileo, and Dynatrace collect traces to debug model performance. They do not map those traces to control frameworks or generate evidence packages for auditors. A governance platform reads the same telemetry and answers compliance questions: which decisions involved personal data, which agents exceeded their cost budget, which guardrails fired most often, and whether every high-risk invocation was logged for the required retention period.
This is the Measure, Explain, Contain framework. Metrics measure whether the agent is working. Traces explain why it made each decision. Guardrails contain what it is allowed to do. All three write to one shared record that serves operations and compliance from the same source of truth. When an auditor asks how you prevented an agent from accessing customer financial records, you point to the trace showing the tool guardrail blocked the call, logged the policy violation, and triggered the fallback path.
Key takeaway
AI observability for production agents requires metrics, traces, and runtime guardrails writing to one unified record. Metrics answer whether it works. Traces explain why it decided. Guardrails enforce what it may do. Together, they convert operational telemetry into governance evidence.
The three layers are interdependent. Metrics without traces show that something failed but not why. Traces without guardrail verdicts explain the decision but not the policy boundary. Guardrails without metrics prove enforcement but not impact. Only the unified record answers the questions that matter: Did the agent complete the task? What did it cost? Which policies fired? Where did the reasoning break down?
Moring sits between your agent runtime and the audit trail, mapping telemetry to control frameworks and generating evidence packages without custom instrumentation. The question is not whether your agents produce telemetry. They already do. The question is whether that telemetry can answer an auditor’s questions six months from now.
Score your agent estate against the Moring AI Ops maturity checklist at moring.ai/contact.
Sources
NeurIPS 2025 multi-agent failure study (arXiv:2503.13657): 1,600+ traces across seven open-source frameworks, 41% to 86.7% failure rates, 14 failure modes including inter-agent misalignment and task verification breakdowns. Cited for agent failure rates and failure mode taxonomy.
MCPGAUGE token overhead study (arXiv:2508.12566): Token overhead of 3.25x to 236.5x when tools attach to LLMs, measured across six commercial models and 30 MCP tool suites. Cited for tool integration cost data.
OpenTelemetry GenAI semantic conventions: Defines invoke_agent, chat, and execute_tool spans, gen_ai.client.operation.duration required metric, content capture off by default. Cited for standard telemetry vocabulary. Conventions maintained at opentelemetry.io/docs/specs/semconv/gen-ai.
EU AI Act Article 12 and Annex III timeline: Article 12 automatic logging requirement, six-month minimum retention. Annex III application moved from August 2, 2026 to December 2, 2027 by May 7, 2026 political agreement, substance unchanged. Cited for regulatory logging obligations.
Editorial note: All interpretations of how observability telemetry maps to governance evidence, and the argument that structured traces satisfy regulatory logging requirements, represent Moring’s position and are not sourced claims. The Measure, Explain, Contain framework is original to this post.
Sources and further reading
- https://arxiv.org/abs/2503.13657
- https://arxiv.org/abs/2508.12566
- https://opentelemetry.io/docs/specs/semconv/gen-ai/
- https://artificialintelligenceact.eu/article/12/
- https://digital-strategy.ec.europa.eu/en/policies/regulatory-framework-ai
Frequently asked questions
How do you monitor AI agents in production?
Which observability vendors support GenAI semantic conventions?
invoke_agent, chat, and execute_tool, plus required metrics like gen_ai.client.operation.duration. Vendors implementing these conventions include Datadog, New Relic, and Honeycomb. The conventions are maintained in the OpenTelemetry GenAI semantic conventions repository and provide a shared vocabulary across platforms.