
TL;DR: A recent change, an unusual metric and a failing dependency are leads, not causes. A root-cause evidence agent should assemble every material observation with its source, time window and retrieval status, state competing explanations with what would support or weaken each, and keep contradictions and missing data visible rather than smoothing them away. The remediation proposal is then a separate object with its own evidence, approval and recovery-verification plan.
Key takeaways
- A recent change, an unusual metric and a failing dependency are leads. None is a confirmed root cause on its own.
- The agent should build an evidence packet with source, time window, scope and retrieval status for every material observation.
- Competing explanations make the investigation more reliable. Each hypothesis should state what evidence would support or weaken it.
- A remediation proposal needs a separate gate. The team should be able to inspect the evidence, authority and verification plan before any production change.
An incident begins with a page about elevated latency. Five minutes later, someone notices a deployment. A trace shows a slow database call. A dashboard shows CPU rising on one service. The quickest story is that the deployment caused the database slowdown.
It may be right. It may also be a tidy explanation assembled from events that happened near one another.
A root-cause evidence agent should make that distinction harder to miss. Its job is to gather the relevant observations, connect them by time and service, test competing explanations and show what remains unknown. It should not turn the first plausible sequence into a confirmed cause, then choose a fix that depends on that conclusion.
This article describes the workflow through a worked example.
Start by defining the incident, not the cause
The first record should describe what is failing and over what period. It should avoid causal language.
For the fictional example, an alert fires at 09:12 UTC because the document-processing API’s 95th-percentile latency has exceeded its service threshold for ten minutes. Requests are still completing, but a subset is taking much longer than normal. The initial scope is one production region and two API routes.
That gives the investigation an anchor:
- Observed condition: elevated request latency.
- Affected scope: named routes and region.
- Measurement window: the interval used by the alert.
- Current impact: what the available service and customer measures show.
- Unknowns: whether other regions, routes or downstream processes are affected.
The alert does not say why the latency increased. It does not establish that the last deployment is responsible. It also does not prove that unaffected routes are healthy if their data has not been checked.
Google’s monitoring guidance makes a similar distinction between the metrics used to alert on a service objective and the additional data needed to investigate the cause. The first task for the agent is to move from an alerting view to an investigation view without losing the original scope.
Build a timeline with provenance
The agent next collects observations from the systems your responders already use. For this incident, that might include:
- alert state and service-level indicators;
- deployment and configuration-change records;
- traces for slow and normal requests;
- application and dependency logs;
- database and queue measures;
- feature-flag history;
- service ownership and dependency information;
- responder notes and actions already taken.
Each item needs more than a sentence. Retain the source, query or record identifier, event time, retrieval time, environment, service identity and time window. If a query fails, retain that failure too. The evidence packet is the complete record. What the model reasons over may be a filtered view when the packet is large, and the human reviewer may see a summary with drill-down to the full set. The workflow should make both the filtering rule and the summary boundary visible.
Event time and retrieval time are different. At 09:20 UTC, a query may return logs covering 09:05 to 09:15. A delayed telemetry pipeline may make the most recent minutes incomplete. OpenTelemetry’s signal model distinguishes traces, metrics and logs, while its logging specification describes correlation through time, trace context and resource context. Those fields help connect evidence, but only when instrumentation and service identity are consistent. System and infrastructure logs typically carry no trace context at all and can only be enriched with resource context. That tells a responder which evidence can be joined by trace and which can only be joined by host and time. Observability for AI agents covers what to instrument so those fields exist before an incident rather than after one.
For the fictional incident, the timeline now shows:
- 09:03: a feature flag begins routing some documents through a fallback parser.
- 09:07: a routine API deployment completes.
- 09:09: latency begins rising on the two affected routes.
- 09:11: fallback-parser calls increase sharply in traces.
- 09:12: the latency alert fires.
- 09:14: database connection use rises on the API service.
The timeline creates three leads. The flag change preceded the symptoms. The deployment also preceded them. Database pressure increased. None is yet a cause.
Turn leads into competing hypotheses
The agent should state several explanations that fit at least part of the evidence. For each one, it should identify the observations that support it, the observations that weaken it and the next check that would discriminate between alternatives.
Hypothesis one: the API deployment introduced the latency
Support: the deployment completed two minutes before the measured increase.
Weakening evidence: instances on the new version that did not receive fallback-parser traffic have normal latency. The changed code path was not executed on most slow traces.
Next check: compare affected requests across old and new instances while holding the feature-flag path constant.
Hypothesis two: the fallback parser is slow
Support: slow traces spend most of their time in fallback-parser calls, and the increase begins after the flag change.
Weakening evidence: some fallback-parser calls complete normally, so the parser path alone does not explain every slow request.
Next check: compare document type, payload size and downstream calls for slow and normal fallback-parser traces.
Hypothesis three: database saturation is the primary cause
Support: database connection use rises during the incident.
Weakening evidence: database latency remains close to baseline, and the connection increase follows the growth in long-running fallback-parser requests.
Next check: inspect whether connections are waiting on database work or simply held open while the request waits elsewhere.
This structure does two things. It prevents the investigation from presenting one story as settled too early, and it tells a responder what evidence would change the current ranking.
The agent can rank hypotheses for attention, but the rank needs an explanation. A score without the underlying observations is difficult to challenge and easy to overread.
Preserve contradictory and missing evidence
Operational data rarely agrees perfectly. One dashboard may aggregate across five minutes while a trace captures a single request. A deployment system may record completion when a rollout still has old instances running. A dependency map may be stale.
The agent should keep those conflicts visible:
- Different time windows: show the windows instead of treating the values as directly comparable.
- Different service identities: resolve the mapping or mark it unresolved.
- Partial coverage: state which regions, instances or request types were not observed.
- Late data: identify the period that may still change.
- Unavailable source: show the failed retrieval and its effect on the investigation.
An unavailable log store cannot be converted into “no errors found.” A missing trace cannot prove that a dependency was not called. A healthy average cannot settle an incident affecting a small but important request class.
This evidence discipline matters more than fluent explanation. A concise investigation with visible gaps gives the incident commander something they can use. A confident narrative that hides the gaps creates another thing to verify.
Separate trigger, contributing factor and root cause
Teams use the term root cause differently. Complex incidents can have a trigger, several contributing conditions and deeper system weaknesses.
In the fictional example, further checks establish that the feature flag routed a particular document type to a fallback parser. Those calls waited on an external dependency whose responses had become slower. The API deployment did not change that path. Database connections rose because requests remained open while waiting.
A useful incident record might therefore say:
- Trigger: feature-flag change increased traffic to the fallback parser.
- Failure mechanism: the fallback path waited synchronously on a slow external dependency.
- Contributing condition: connection limits allowed slow requests to occupy capacity needed by other work.
- Detection gap: the team monitored API latency but had no separate service measure for fallback-parser dependency time.
That account supports more than one corrective action. The immediate mitigation may be to restore the prior flag state. Longer-term work may add a timeout, isolate capacity and instrument the dependency path.
Calling the flag change “the root cause” would make the rollback look sufficient. The broader evidence shows why the service remained vulnerable.
Put a gate between the case and the fix
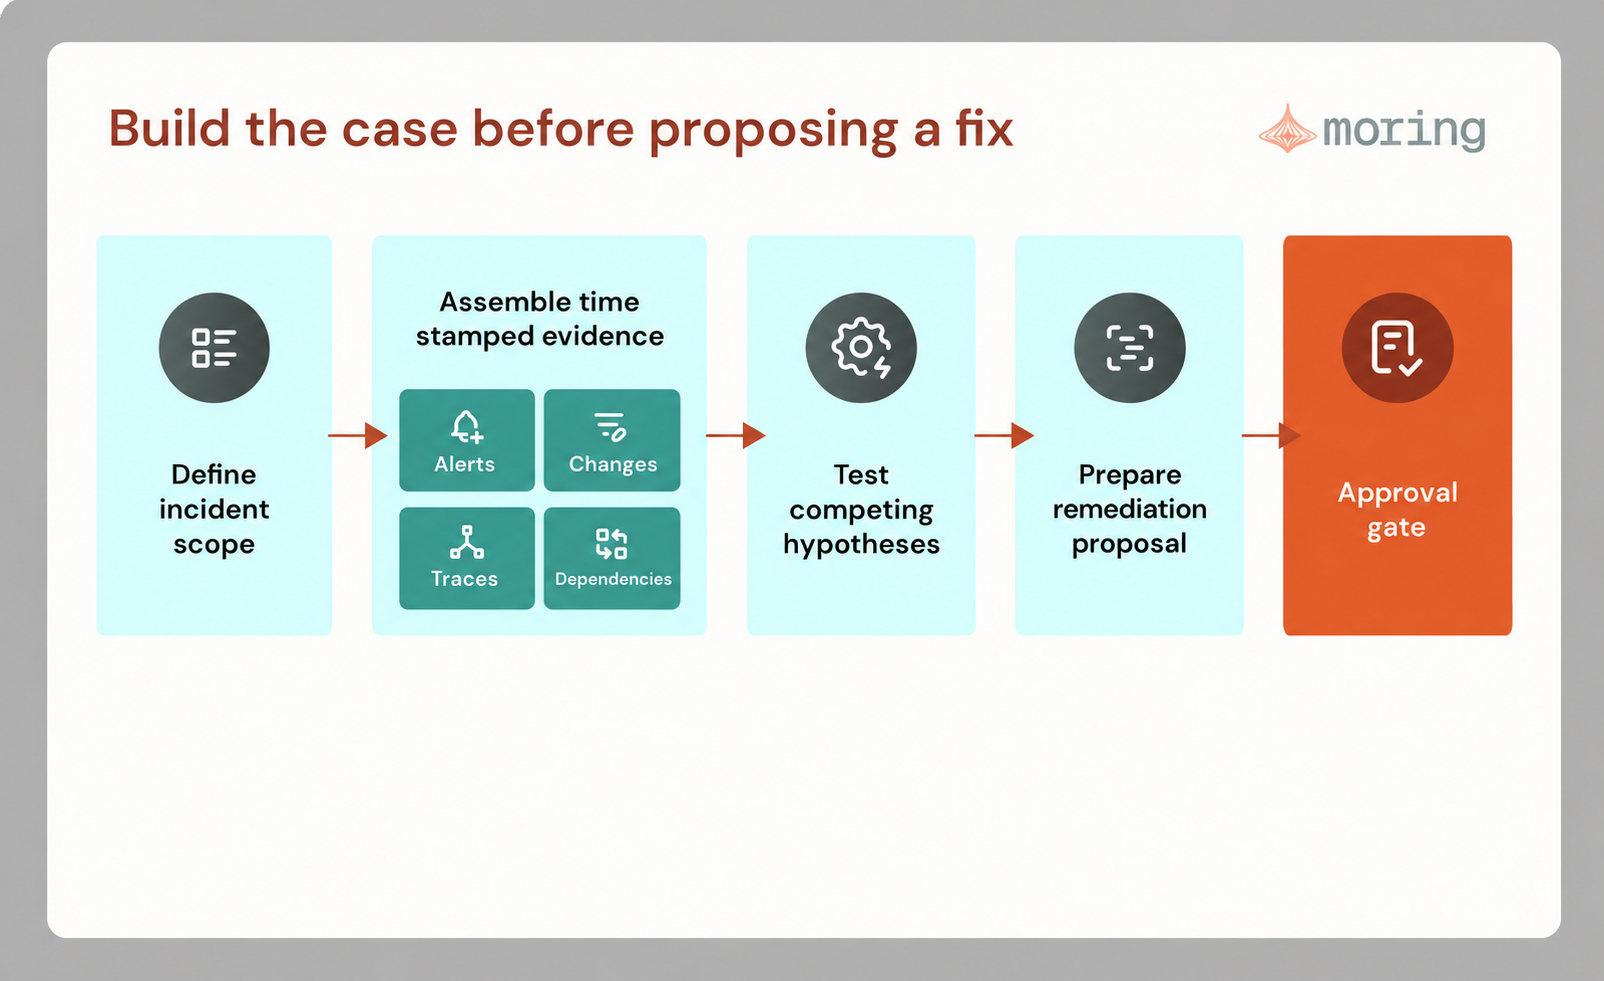
Once the investigation reaches a supported explanation, the agent can prepare a remediation proposal. The proposal should be a new object with its own evidence and approval, not the final paragraph of the root-cause summary.
For the fictional incident, the agent proposes returning the feature flag to its previous value in the affected region. The review packet includes:
- the exact flag, current state and proposed state;
- the evidence connecting the flag path to the affected requests;
- the expected effect;
- known side effects of disabling the fallback path;
- the person authorized to approve the change;
- the service measures and observation window used to verify recovery;
- the condition that stops the workflow and returns it to investigation.
If the flag state changes while the proposal is waiting, the approval no longer applies to the same action. The workflow should return for review. If the rollback succeeds but latency remains high, the workflow should not declare the hypothesis confirmed simply because the tool call completed.
This separation also lets you give the agent different permissions for investigation and remediation. It may query telemetry and change records without approval, prepare a proposal for a defined mitigation, and remain unable to execute the change until a named responder approves it. Agentic AIOps: who governs the ops agents now acting on their own covers who sets and reviews those permissions.
The broader authority model for operational agents can expand only after the team has evidence that these boundaries hold.
Moring’s AI Control Plane keeps investigation and remediation on separate authority levels and retains the evidence packet with the decision, so a responder can see what the agent read before approving what it proposes. The workflow described here is its root-cause evidence agent, which sits alongside triage, runbook recommendation and remediation rather than doing all four jobs at once. What changes is that the investigation can widen without the remediation authority widening with it, so a team can give the agent more to read without giving it more to change.
Verify recovery against the original incident scope
The verification plan should return to the condition that opened the incident. For this example, that means checking the affected routes and region over a stated window, not only checking that the feature flag changed.
The agent should compare:
- latency and error measures before and after the action;
- slow-request traces on the affected routes;
- fallback-parser call volume;
- capacity indicators that showed secondary pressure;
- any available measure of delayed or failed document processing.
Recovery can be partial. Latency may fall while a queue of delayed documents remains. One route may recover before another. The evidence packet should preserve those differences and the next decision. Communicating that partial state to the people waiting on the service is a separate workflow, covered in AI agents for incident updates.
Only after verification should the incident record say that the mitigation restored the service. The causal conclusion may still remain narrower: the rollback result supports the feature-flag hypothesis, but it does not by itself explain every contributing condition.
How to evaluate a root-cause evidence agent
Use past incidents that contain misleading correlations, missing telemetry and at least one plausible but incorrect explanation. Replay them in time order so the agent cannot use evidence that responders did not yet have.
Check whether the agent:
- preserves the original incident scope and time window;
- cites the source behind every material observation;
- distinguishes event time from retrieval time;
- creates more than one plausible hypothesis when the evidence supports it;
- identifies what would weaken its preferred explanation;
- keeps unavailable and contradictory evidence visible;
- separates the investigation from the remediation proposal;
- proposes a verification plan tied to the original impact;
- revises its explanation when later evidence contradicts it.
You can then measure the work it changes. Count the evidence-retrieval steps it completes correctly, the unsupported conclusions reviewers remove and the time responders spend checking its citations. Those measures are more useful than asking whether the final summary sounds convincing.
We think the test for one of these agents is simple. Can the responder making the next call see what the agent saw, and argue with it? If they can, the investigation holds up at three in the morning. If they cannot, you have handed them one more thing to verify while the service is still down.
Sources
- Google SRE Workbook: Monitoring
- Google SRE Workbook: Incident response
- Google SRE Workbook: Postmortem analysis
- OpenTelemetry: Signals
- OpenTelemetry specification: Log correlation
Frequently asked questions
How should an AI agent investigate root cause before recommending a fix?
Start with the observed incident scope and time window. Gather alerts, changes, traces, logs, dependency measures and responder actions with their sources. Build competing hypotheses, state what supports or weakens each one, and run the next check that separates them. Only then prepare a distinct remediation proposal with approval and recovery-verification criteria.
Is the most recent deployment usually the root cause?
No such assumption is justified. A recent deployment is a useful lead because it changed the system, but configuration, dependency, traffic and data changes can produce the same timing. Compare requests and instances that did and did not receive the change before treating it as causal.
What should happen when telemetry sources disagree?
Keep both observations with their time windows, service identities and retrieval state. Resolve a mapping or freshness problem when possible. If the conflict remains material, show it to the incident commander and avoid a remediation that depends on one source being correct.
Governing Autonomous AI Agents in Production
Moring provides the runtime control layer, identity verification, human-in-the-loop approvals, and audit records needed to deploy production-grade AI agents safely.
About the author

Arya SharanProduct Marketing & GTM, Moring AIChennai
Owns product marketing and go-to-market at Moring AI across positioning, demand and enablement. Works with regulated buyers on how governed AI agents are scoped, evaluated and bought. Writes about the operating questions that decide whether an agent reaches production.
LinkedIn profile